


15 August 2017

UK Printing Industry – what’s under the headlines; age, gender and pay
Let's get a few things straight - the average age of employees in the printing industry is not 48, 49, 50... And, it is not a good technique to pick an average age that was quoted in 1997 and add an extra year on for each subsequent year.
Right, now let's have a closer look at some data that is available for the UK Printing Industry.
Earlier this year we published an updated Facts and Figures flyer with some headline statistics on the UK Printing Industry. You can view the flyer here.
http://www.britishprint.com/industry-involvement/research/facts-and-figures/
In short, the UK Printing Industry:
-is still big - the fifth biggest in the world, with a turnover of approximately £14 billion, 116,000 employees in 8,400 companies
-adds value - almost £6 billion to the value of material inputs purchased
-has a positive trade balance - to the tune of £775 million in 2016
-is currently displaying stand out productivity improvements - significantly above average levels for the whole economy, manufacturing and services sectors
-continues to invest - around £700 million capital investment per annum
Much of this information comes from our analysis of data sourced from the Office for National Statistics (ONS). The ONS collects a lot of information on all sorts of things, some it publishes and some it doesn't. Some you'll know about and plenty of it you won't.
But what about the average age?
Detailed sectoral information on the average age of employees is not readily available from the ONS. However, access to data following a freedom of information request has provided data that enabled us to calculate the following number of employees in the UK Printing Industry by age band in 2015.
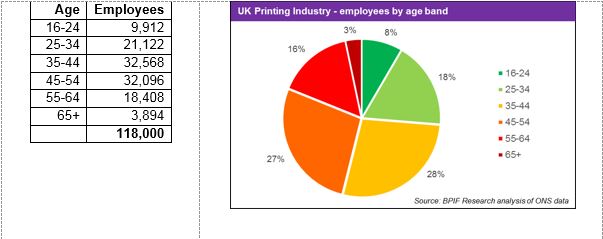
What the ONS doesn’t provide though is an average age figure. However, we can make some approximation based on an assumption – that the average (mean) age for each age band will be the mid-point for that age band (i.e. for the 9,912 employees in the 16-24 age band the average will be 20). This assumption may not be correct but it is reasonable to assume that the ages are distributed normally within each age band and that the mid-point will be the average, or a very close approximation of the average. So with this, and taking 70 as the average for the 65+ age band, the calculated estimate for the average age of employees in the UK Printing Industry is 43; just as it was when the same analysis technique is used on data for 2013.
Now that we've got that covered; let's have a look at the current hot topic:
Gender and pay
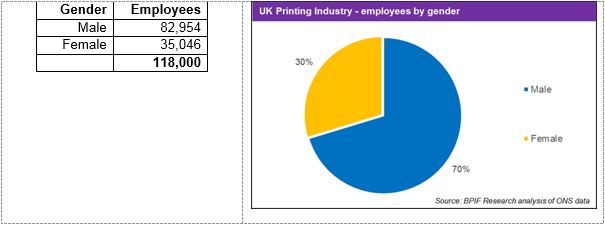
The same freedom of information request that provided information on the age of employees also provide information in gender. The split for printing industry employees is 70% male and 30% female. It is also worth pointing out that the national average is not 50:50; more like 60:40.
Anecdotal evidence would suggest that this gender split is not replicated across all occupational areas within the industry – it is often assumed that females are more predominant in finishing occupations, some pre-press roles, a number of administrative functions and certain managerial roles. Of course we all know of examples of female print minders, sales executives, upper management and managing directors; just not 30% across the board.
Specific and comparable wage comparisons across gender for the industry are not yet obvious. Perhaps the most accessible is the Annual Survey of Hours and Earnings (ASHE) from the ONS.
There is a lot of information in this dataset that could be analysed, compared and contrasted and it is likely that the efforts would still be comparing apples with pears rather than on a like-for-like basis. However, short of finding the companies that employee males and females in the same occupations, it's the best data available for now.
The ASHE dataset publishes numerous tables for various pay terms, employee type and industrial and occupational classifications. Here we have chosen to make some comparisons using the median weekly pay excluding overtime for full-time employees.
In the chart and table below ‘SIC181' refers to the Standard Industrial Classification (SIC) for printing and service activities related to printing (181) - this is a major component of the printing industry but does exclude certain sectors (most notably cartons, printed stationery and labels which are included within SIC172). The hourly pay data provided covers the pay for all full-time employees that are classified to be in SIC181 (from printers through to managing directors). It covers around 89,000 employees.
‘SOC5423' refers to the Standard Occupational Classification (SOC) for print finishing and binding workers (5423). The hourly pay data covers all full-time employees classified within this skilled trade occupation. It covers around 14,000 employees.
‘All' refers to all employees in the UK; it covers around 18.6 million employees.
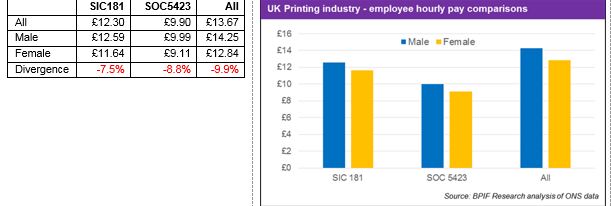
Concentrating solely on the male/female divergence we can see that the median hourly gross pay for all full-time females is 7.5% lower than it is for males within the printing and service activities related to printing sector. Surprisingly the divergence is greater when the focus is narrowed to the print finishing and binding occupation classification - where females are on average paid 8.8% lower than males. Finally the divergence comparison is even greater when looking at the data for all employees - where full-time females receive an average weekly gross wage that is almost 10% lower than their male counterparts.
This is only a brief analysis of some of the data that is available. Please visit the wage benchmarking area of our website if you are interested in exploring the ONS data further yourself or would like to benchmark pay within your company.
http://www.britishprint.com/industry-involvement/research/wage-benchmarking/
Downloads
 - March 2024") Intergraf Economic News (Paper Prices) - March 2024
Intergraf Economic News (Paper Prices) - March 2024
18 March 2024
Access the latest edition of the Economic Newsletter for the European Printing Industry for data on paper consumption, and pricing data for pulp, paper and recovered paper. Data for packaging papers and board is also available with this edition.
 STUDY EXPOSES HIGH COST OF PHARMACIES PRINTING MEDICAL INFORMATION LEAFLETS
7 March 2024
Intergraf welcomes the release of a study by our partner MLPS (Medical Leaflet = Patient Safety), a subgroup of the European Carton Manufacturers Association (ECMA) shedding light on the potential economic costs associated with the proposed use of Print on Demand (PoD) leaflets in the pharmaceutical legislation revision.

The BPIF is the printing industries champion. By becoming a member you join a diverse and influential community. We help you solve business problems, connect you to new customers and suppliers and make your voice heard in government.
Call 01676 526030